


At the top of the reports, the Chart and Summary numbers offer quick access to key data, trends of that data, and visualizations for changes over time in the period selected, and the period being compared against.
Summary Numbers
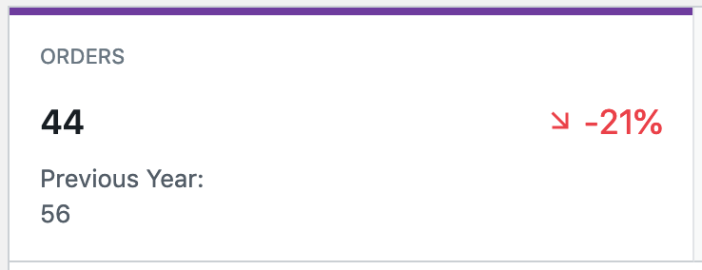
The “Summary Number” tab gives you a quick view of the total figure for that metric over the period selected, the total number for the period being compared, and the percentage trend between those two figures. By clicking on a Summary Number, that particular metric is then displayed in the chart.
For example, this is what the “Orders Summary Number” looks like:
Chart
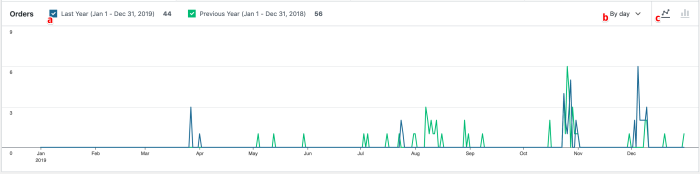
The charts on report pages offer quite a few options to customize the visualization of data. The “Data Legend” (labeled “a” in the above screenshot) allows you to toggle the visibility of the different data set periods. The “Interval Selector” (labeled “b”) allows you to adjust the interval displayed in the chart. The options available here are dependent upon the length of the date range selected:
| Length of Date Range | Interval Options |
|---|---|
| One year or more | ‘day’, ‘week’, ‘month’, ‘quarter’, ‘year’ |
| 90 days to 1 year | ‘day’, ‘week’, ‘month’, ‘quarter’ |
| 1 month – 89 days | ‘day’, ‘week’, ‘month’ |
| 1 week – 28 days | ‘day’, ‘week’ |
| 1 day – 1 week | ‘day’ |
| 1 day | ‘day’, ‘hour’ |
And lastly, you can adjust the “Type of Chart” being displayed (labeled “c”) between a bar or line chart.
Table
The table which displays the detailed data on Analytics reports also has a number of features that allow you to customize how the data is displayed, and even an option to download a CSV copy of the data used in the report for further analysis.
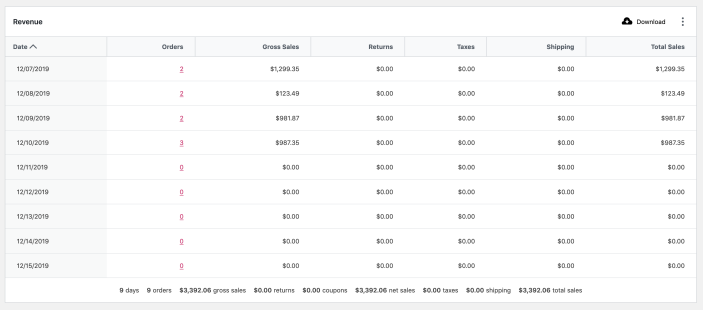
Table Column Sorting
Many columns in reports will allow you to click on the column header to sort the tabular data by that value and to either sort by that value in ascending or descending order. Simply click the column header to sort by that value, and click it again to change between ascending and descending sort.
Toggle Column Visibility
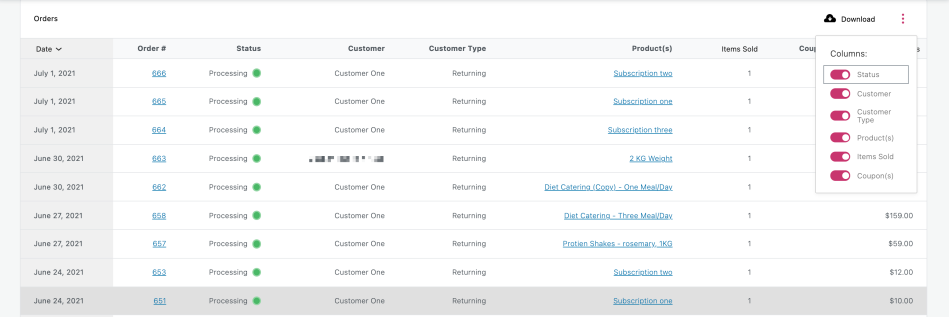
If a report contains a data column that you don’t need to be displayed, you can adjust the visibility of it by using the visibility menu on the right side of the table header. Click the column name in the menu to change the visibility of the column. Your visibility selections are persisted to your user preferences for each report, so on subsequent visits to that report, the columns you have previously toggled off will not be displayed.
Download (to CSV)
If you would like to download a copy of the data contained in the report table, you can do so by clicking the Download button in the table header. If the amount of data shown in the report is limited to one page ( e.g. there are no pagination options shown in the table footer ), the CSV file will download immediately.
If your selected date range results in a data set that spans more than one page in the table, your CSV download will be processed as a background job by WooCommerce. Once the data is ready to be downloaded, an email will be sent to the address that is attached to your WordPress account with a link to download the file. Here is how that email looks like:
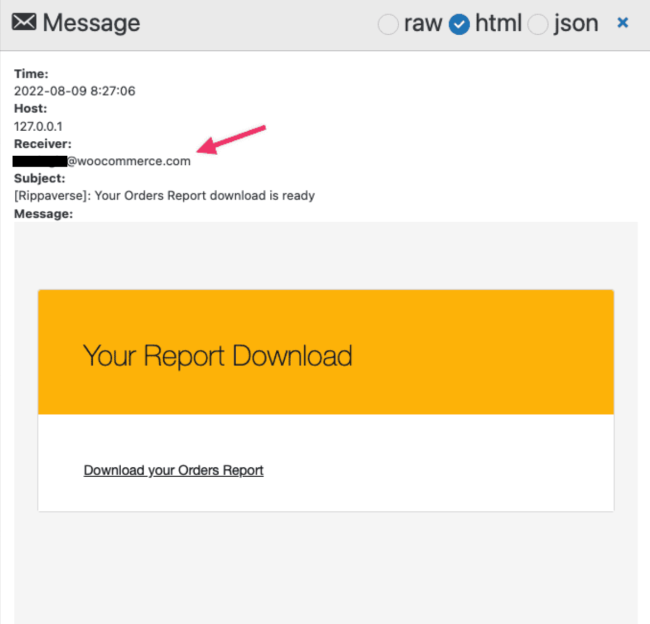
Click on Download your Orders Report to download the file.
Table Pagination
When the data displayed in the table is larger than the default single page size of 25, some pagination options will appear in the table footer area. Directional buttons–labeled < and >–enable you to move backward and forward between pages, and a text field will allow you to jump to a specific page number. Furthermore, you can change the number of rows to display per page.

Table Search Box
On some reports, a search box is displayed in the table header area as well. For details on what the search box does on a given report, please refer to the associated documentation for that report.

Dashboard
The Analytics and Sales Reports dashboard in WooCommerce has been designed to allow you to keep track of the statistics and data that matter most to your site. Each section of the dashboard can be fully customized to meet the needs of your store, and also act as launching points to dive deeper into other reports.
The dashboard is comprised of three sections:
- Performance Indicators,
- Charts, and
- Leaderboards.
The data presented in these sections are controlled by the Date Picker which appears at the top of the page. This lets you quickly look at data for a number of preset date-ranges like week, month, quarter, and year to date, or to select a specific date range to view.
Navigate to WooCommerce > Dashboard to get started.
Customize Dashboard Sections
These sections can be re-ordered, re-named, or even toggled off if you don’t want to view a particular section(s).
Toggle Stats
To customize dashboard sections, click the kebab menu in the top right corner of the section. The first item that appears in this menu is the ability to toggle the display of the various stats that are shown in the section.
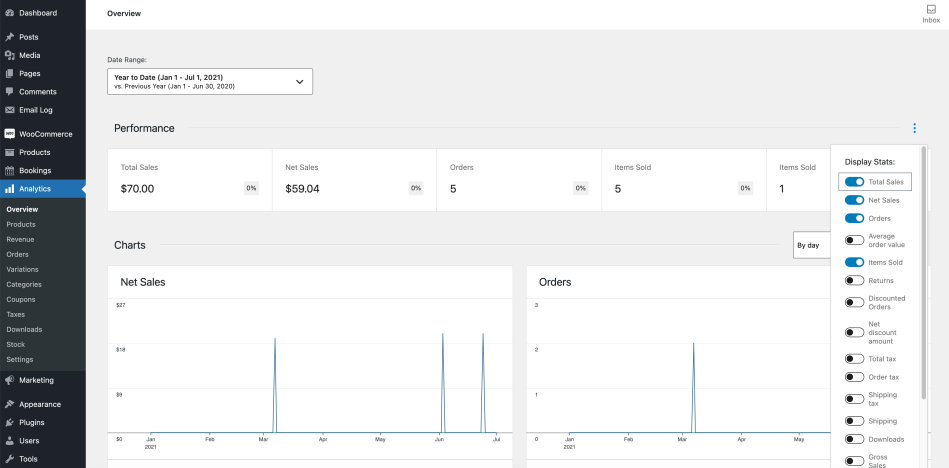
Rename, Move or Remove a Dashboard Section
Below that you will find options for renaming the section, moving it up or down, or removing it entirely from the dashboard.
Add a Dashboard Section
If you removed a dashboard section, or you have an extension installed that adds in an option for a new section, a plus icon will appear at the bottom of your dashboard. Clicking that plus will allow you to insert previously removed sections, or add in new ones.
Performance Section
By default, the Performance Indicators section is what appears at the top of your dashboard below the Date Picker. Each performance indicator will display a label informing you of the statistic that is being presented, the value of that statistic for the date range selected, a percentage change over the prior period along with a trend arrow of up/down/same, and the value for the previous period that is being compared.
Beyond giving you a quick glimpse into the statistic, Performance Indicators also act as a quick shortcut to dive deeper into the data behind the stat. For example, clicking on the Total Sales indicator will open up the Revenue Report for the date range that has been selected on the Dashboard. From there you can view associated charts and tabular data for deeper analysis.
Using the customization menu in the top right corner of the section, you can toggle the display of the following default performance indicators:
| Indicator Name | Description | Links to (Report Name > Chart Name) |
|---|---|---|
| Total Sales | Gross Sales – Returns – Coupons + Taxes + Shipping | Revenue Report > Total Sales |
| Net Sales | Gross Sales – Returns – Coupons | Revenue Report > Net Sales |
| Orders | The number of new orders placed for a selected date range | Orders Report > Orders |
| Average Order Value | Net Sales / Orders | Orders Report > Average Order Value |
| Items Sold | The discrete number of items sold. | Products Report > Items Sold |
| Refunds | Money returned to the customer via a refund | Revenue Report > Refunds |
| Discounted Orders | The count of orders with a coupon applied. | Coupons Report > Orders Count |
| Net Discount Amount | Total sum of discounts from coupons. | Coupons Report > Amount |
| Total Tax | Order Tax + Shipping Tax | Taxes Report > Total Tax |
| Order Tax | The total of tax applied to items in an order | Taxes Report > Order Tax |
| Shipping Tax | The total of tax applied to shipping in an order | Taxes Report > Shipping Tax |
| Shipping | The shipping charges associated with an order or refund. | Revenue Report > Shipping |
| Downloads | Total count of downloaded files | Downloads Report > Download Count |
| Gross Sales | Sale price of product(s) x quantity ordered. Does not include refunds, coupons, taxes or shipping | Revenue Report > Gross Sales |
Charts Section
The next section displayed by default is Charts. The customization menu again allows you to toggle the display of charts that are most useful for your Store. The following charts are available to display in this section:
| Chart Name | Description | Links to (Report Name > Chart Name) |
|---|---|---|
| Total Sales | Gross Sales – Returns – Coupons + Taxes + Shipping | Revenue Report > Total Sales |
| Net Sales | Gross Sales – Returns – Coupons | Revenue Report > Net Sales |
| Orders | The number of new orders placed for a selected date range | Orders Report > Orders |
| Average Order Value | Net Sales / Orders | Orders Report > Average Order Value |
| Items Sold | The discrete number of items sold. | Products Report > Items Sold |
| Refunds | Money returned to the customer via a refund | Revenue Report > Refunds |
| Discounted Orders | The count of orders with a coupon applied. | Coupons Report > Orders Count |
| Gross Discount Amount | Total sum of discounts from coupons. | Coupons Report > Amount |
| Total Tax | Order Tax + Shipping Tax | Taxes Report > Total Tax |
| Order Tax | The total of tax applied to items in an order | Taxes Report > Order Tax |
| Shipping Tax | The total of tax applied to shipping in an order | Taxes Report > Shipping Tax |
| Shipping | The shipping charges associated with an order or refund. | Revenue Report > Shipping |
| Downloads | Total count of downloaded files | Downloads Report > Download Count |
Chart Interval Options
The charts section has a setting that allows you to set the time interval to display in the charts. The options displayed in the interval drop down are determined by how long of a date range you currently have selected in the Date Picker.
| Length of Date Range | Interval Options |
|---|---|
| One year or more | ‘day’, ‘week’, ‘month’, ‘quarter’, ‘year’ |
| 90 days to 1 year | ‘day’, ‘week’, ‘month’, ‘quarter’ |
| 1 month – 89 days | ‘day’, ‘week’, ‘month’ |
| 1 week – 28 days | ‘day’, ‘week’ |
| 1 day – 1 week | ‘day’ |
| 1 day | ‘day’, ‘hour’ |
Chart Type Option
The last way you can customize the appearance of the charts is the ability to toggle between Line and Bar charts. Your selection chosen here will be saved to your user options and used on subsequent visits to the WooCommerce Dashboard.
Leaderboards Section
The final section on the Dashboard allows you to view four different “Leaderboards” for your store’s statistics. Like the other two sections, you can also toggle the visibility of the leaderboards via the customization menu. By default you have the following four Leaderboards to choose from:
- Top Customers, Total Spend
- Top Coupons, Number of Orders
- Top Categories, Items Sold
- Top Products, Items Sold
Analytics Settings
WooCommerce is pre-configured with default settings for the Analytics and Sales Reports.
Navigate to Analytics > Settings to change these default settings.
These settings are broken down into sections:
- Excluded Statuses
- Actionable Statuses – See Activity Panels for details
- Default Date Range
- Import Historical Data
- Reset Defaults
Excluded Statuses
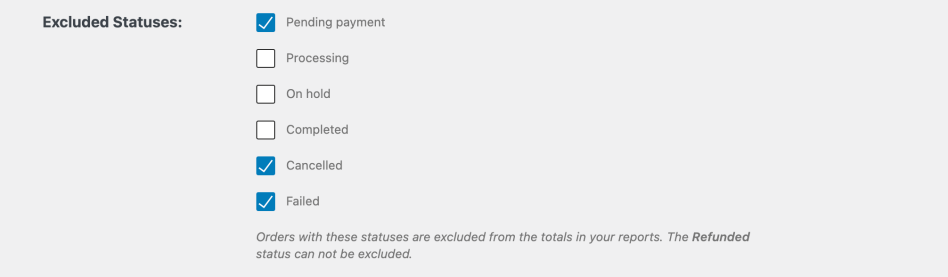
In this section, statuses that are unchecked are included in analytics reports. Checked statuses are excluded. If your store uses custom order statuses, those statuses are included in the reports by default. They will be listed in this section under Custom Statuses and can be excluded via the status checkbox.
Actionable Statuses
See Activity Panels for details.
Default Date Range
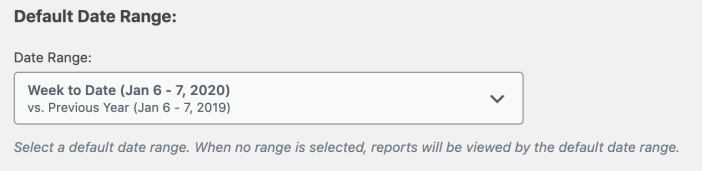
WooCommerce is pre-configured with a default date range of Month to Date. This is the date range that will be used when loading the Analytics and Sales Reports Dashboard or Analytics page from any non-WooCommerce page. Any reports that support a date range will have a Date Range Picker to allow changing the date range for the report.
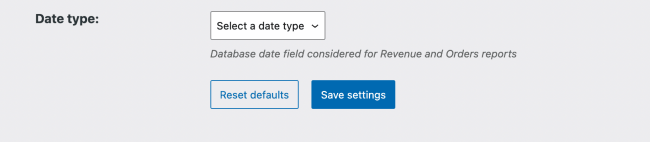
Date Type
Select the date field that should be considered for Revenue and Order Reports. The default date type is set to “Date Paid”. This setting gives you the flexibility to select the date to be used in the reports – Order created, Order processed, or Order Completed.
Importing Historical Data
When you install WooCommerce 4.0 the Analytics and Sales Reports needs to process the historical data in order to populate new Report pages. This is not done automatically – extremely large or high volume stores might want to schedule a maintenance window in which to import their historical data.
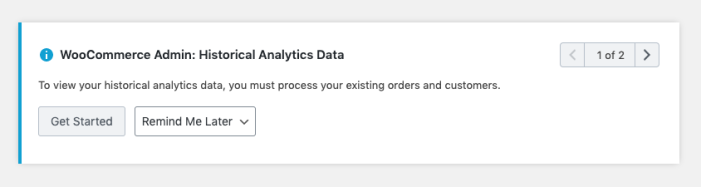
Stores with existing Orders will be prompted to import their data:
Starting the Import
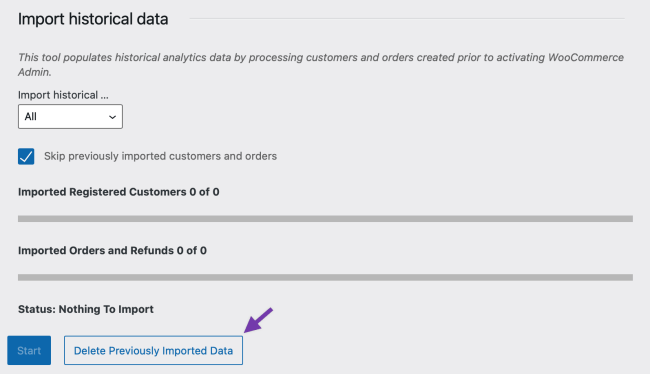
To start a historical data import, use the prompt above or go to Analytics > Settings, and scroll down to Import Historical Data.
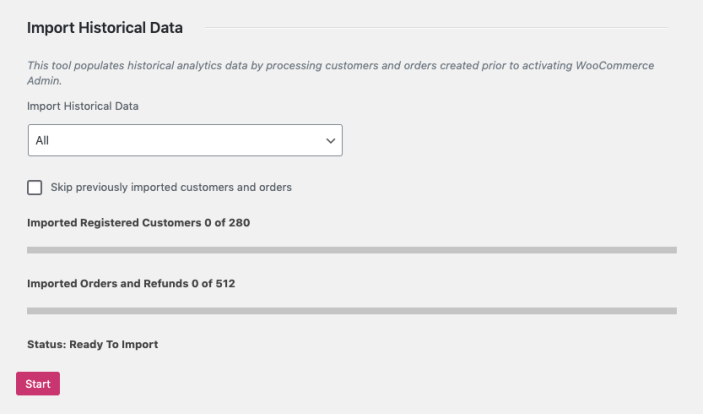
Stores that only want to see report data from a certain date onward can choose a date period, otherwise “all” data will be imported.
Extremely large or high volume stores might choose to import data in smaller increments – perhaps each year or quarter separately. The “skip previously imported customers and orders” control allows for overlapping date ranges to be imported without unnecessary data processing.
The Customer and Order counts will be updated in real-time to reflect changes made to the import settings. Press “start” when you’re ready for the import to begin.
Monitoring Progress
Once you’ve started an import, progress will be periodically updated on the Analytics > Settings screen.
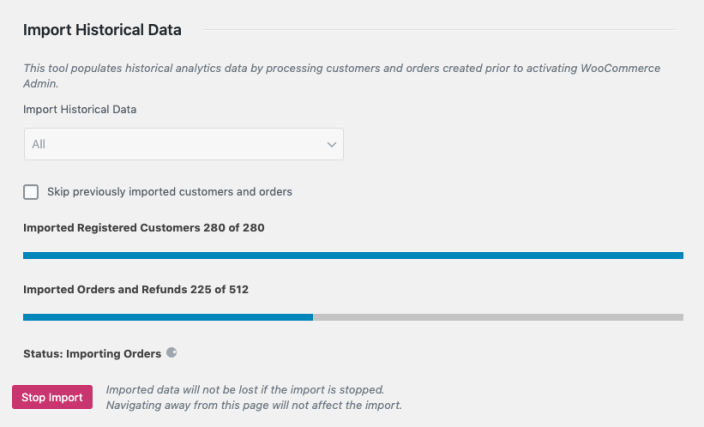
Navigating away from this page will not affect the import, and you can return to it at any time to monitor progress.
Once the import is complete, the status will reflect it:
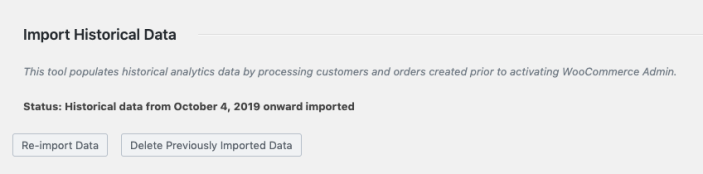
You’ll be given the option to run another import or to delete previously imported data. Please note that deletion is for analytics data only. This doesn’t delete your products, orders, customers, etc…
Resetting Analytics
Speaking of deleting any already imported historical data. If you do need to reset the Analytics reports you can do so from this settings screen by selecting Delete Previously Imported Data. Once that data is deleted your reports won’t show any information and you’d want to select new historical data to import, say a new time frame, or wait on new orders and customers to come in.
How the Import Works
Initial Data Import
The historical data import uses Action Scheduler to queue jobs that process the existing data on your store, building tables of aggregate data to be used in Reports.
Before version 3.0.0, Action Scheduler used custom post types to manage queue data. To avoid problems queuing large numbers of items, the import jobs are queued and processed in batches to reduce the likelihood of execution time limits on servers/hosts with limited resources.
Subsequent Data Updates
All Customers and Orders that get created after WooCommerce 4.0 (or the WooCommerce Admin plugin) is installed are automatically queued for processing. Only historical data requires manual intervention to process.
Action Scheduler at Scale
For extremely large or high volume stores, we recommend following the Action Scheduler documentation for Background Processing at Scale.
If you’re using WooCommerce 3.9 or earlier, the bundled version of Action Scheduler uses a custom post type to manage queues. This can cause performance issues for high volume stores. We recommend installing the Action Scheduler plugin at version 3.0.0 or later. Action Scheduler 3.0.0+ uses custom database tables for queue handling and is significantly faster than previous versions.
Reset Defaults
The “Reset Defaults” button resets the settings to default values for all of the settings above the button. It has no effect on the data imported via Import Historical Data.
Reports
You can access the individual reports (listed below) directly from your site’s dashboard. Below you will find detailed instructions on how to access and use them:
- Categories Report
- Coupons Report
- Customers Report
- Downloads Report
- Orders Report
- Products Report
- Variations Report
- Revenue Report
- Stock Report
- Taxes Report
Analytics Cache
WooCommerce has to process a large amount of data to generate the reports detailed in this section. To avoid potential performance issues the data is cached in a usable format and regularly updated.
If you notice that the figures displayed in the reports differ from the actual figures on your website then you can clear the cache by going to WooCommerce > Status > Tools and running the Clear Analytics Cache tool. If after clearing the cache the figures still look off, try reimporting historical data.
Questions and support
Do you still have questions and need assistance?
This documentation is about the free, core WooCommerce plugin, for which support is provided in our community forums on WordPress.org. By searching this forum, you’ll often find that your question has been asked and answered before.
If you haven’t created a WordPress.org account to use the forums, here’s how.
- If you’re looking to extend the core functionality shown here, we recommend reviewing available extensions in the WooCommerce Marketplace.
- Need ongoing advanced support or a customization built for WooCommerce? Hire a Woo Agency Partner.
- Are you a developer building your own WooCommerce integration or extension? Check our Developer Resources.
If you weren’t able to find the information you need, please use the feedback thumbs below to let us know.
